| Date | BTC/CHF | Paid (CHF) | Fees and spread (CHF, est.) | Bought (BTC) | Cumulative CHF paid | Cumulative BTC bought | Average entry price (BTC/CHF) | Portfolio value (CHF) | PnL (CHF) |
|---|---|---|---|---|---|---|---|---|---|
| 2026-09-30 | 69,794 | 1,000 | 12 | 0.0141 | 20,866 | 0.2980 | 70,023 | 20,798 | −68 (−0.3%) |
| 2026-08-31 | 63,443 | 1,000 | 7 | 0.0157 | 19,866 | 0.2838 | 69,991 | 18,007 | −1,859 (−9.4%) |
| 2026-07-31 | 50,726 | 1,000 | 37 | 0.0190 | 18,866 | 0.2682 | 70,347 | 13,604 | −5,262 (−27.9%) |
| 2026-06-30 | 47,324 | 1,000 | 29 | 0.0205 | 17,866 | 0.2492 | 71,692 | 11,793 | −6,072 (−34.0%) |
| 2026-05-29 | 57,319 | 1,000 | 21 | 0.0171 | 16,866 | 0.2287 | 73,751 | 13,108 | −3,758 (−22.3%) |
| 2026-04-30 | 59,628 | 1,000 | 19 | 0.0165 | 15,866 | 0.2116 | 74,977 | 12,618 | −3,248 (−20.5%) |
| 2026-03-31 | 54,478 | 1,000 | 3 | 0.0183 | 14,866 | 0.1952 | 76,175 | 10,632 | −4,234 (−28.5%) |
| 2026-02-27 | 50,738 | 1,000 | 46 | 0.0188 | 13,866 | 0.1768 | 78,407 | 8,973 | −4,893 (−35.3%) |
| 2026-01-30 | 65,027 | 1,000 | −8 | 0.0155 | 12,866 | 0.1580 | 81,404 | 10,277 | −2,588 (−20.1%) |
| 2025-12-31 | 69,384 | 1,000 | 25 | 0.0141 | 11,866 | 0.1426 | 83,239 | 9,891 | −1,975 (−16.6%) |
| 2025-11-28 | 73,127 | 1,000 | 20 | 0.0134 | 10,866 | 0.1285 | 84,564 | 9,396 | −1,470 (−13.5%) |
| 2025-10-31 | 88,118 | 1,000 | 12 | 0.0112 | 9,866 | 0.1151 | 85,726 | 10,141 | 275 (2.8%) |
| 2025-09-30 | 90,744 | 1,000 | 6 | 0.0110 | 8,866 | 0.1039 | 85,349 | 9,426 | 560 (6.3%) |
| 2025-08-29 | 86,843 | 1,000 | 42 | 0.0110 | 7,866 | 0.0929 | 84,652 | 8,069 | 204 (2.6%) |
| 2025-07-31 | 94,333 | 1,000 | 33 | 0.0102 | 6,866 | 0.0819 | 83,840 | 7,725 | 859 (12.5%) |
| 2025-06-30 | 84,971 | 1,000 | 32 | 0.0114 | 5,866 | 0.0716 | 81,875 | 6,088 | 222 (3.8%) |
| 2025-05-30 | 85,791 | 1,000 | 31 | 0.0113 | 4,866 | 0.0602 | 80,764 | 5,169 | 303 (6.2%) |
| 2025-04-30 | 77,926 | 1,000 | 20 | 0.0126 | 3,866 | 0.0490 | 78,968 | 3,815 | −51 (−1.3%) |
| 2025-03-31 | 72,899 | 1,000 | 5 | 0.0136 | 2,866 | 0.0364 | 78,771 | 2,652 | −214 (−7.5%) |
| 2025-02-28 | 76,336 | 1,000 | −35 | 0.0136 | 1,866 | 0.0227 | 82,071 | 1,735 | −130 (−7.0%) |
| 2025-02-03 | 92,504 | 856 | 17 | 0.0091 | 856 | 0.0091 | 94,392 | 839 | −17 (−2.0%) |
| 2025-02-03 | 92,504 | 10 | 0 | 0.0001 | 866 | 0.0092 | 94,392 | 849 | −17 (−2.0%) |
Portfolio
Entry price, BTC bought, and the full transaction log
Since the savings plan went live, every incoming transaction to the wallet has been logged with the CHF paid for it, fees included, and matched to a historical BTC/CHF price. This page always reflects the full history: how much has been paid, how much BTC has been accumulated, and what it’s worth today. Unlike the blog posts, which update with each new transaction, this page is refreshed daily at the current price; for commentary on what changed and why, see the blog.
Key metrics
As of October 17, 2026 (0.298 BTC bought across 22 transactions since February 2025):
| Metric | Value |
|---|---|
| BTC/CHF | CHF 67,257 |
| Average entry price | CHF 70,023 per BTC |
| Cumulative BTC bought | 0.298 BTC |
| Cumulative CHF paid | CHF 20,866 |
| of which fees and spread (est.) | CHF 375 |
| Portfolio value (CHF) | CHF 20,042 |
| PnL | CHF -824 (-4.0%) |
The average entry price is the cumulative CHF paid, fees included, divided by the cumulative BTC bought — it’s the break-even price. Every purchase is CHF 1,000 including fees; the first one’s amount isn’t known and assumes 2% costs on the BTC received. Fees and spread are estimated as the CHF paid minus the value of the BTC received at that day’s closing price. The portfolio value multiplies the BTC bought so far by the current market price (CHF 67,257 as of October 17, 2026), so it reflects the market as of publishing rather than the date of the last transaction.
Cumulative CHF paid vs. portfolio value
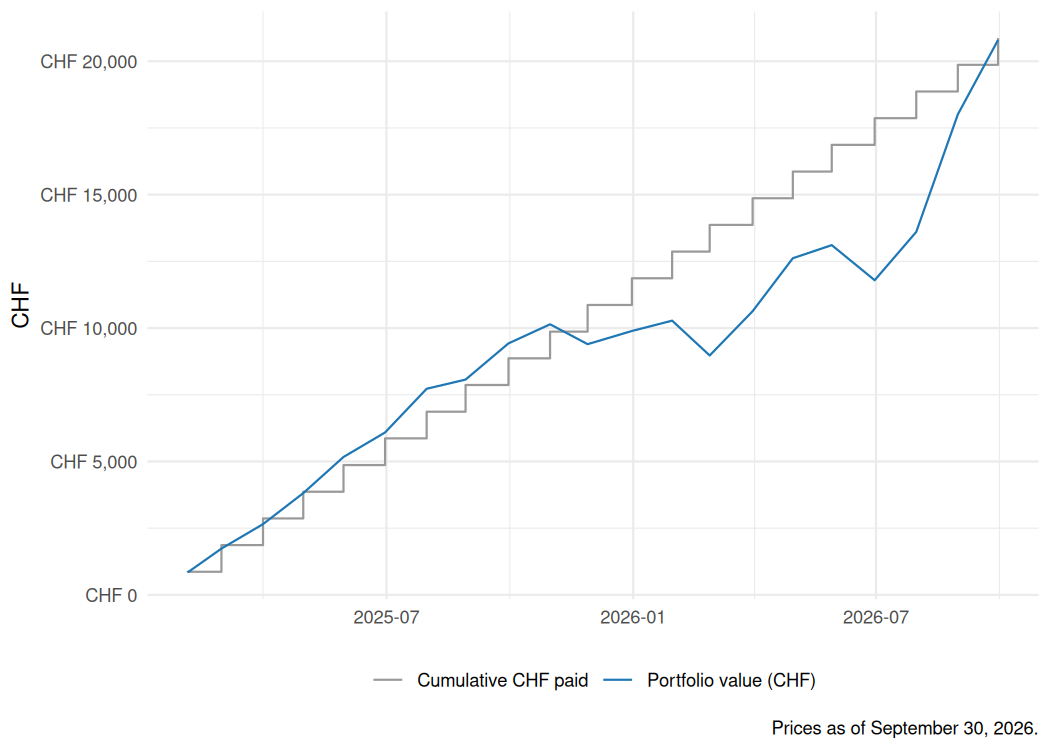
This chart comes from the DCA transactions so far post. When the blue line is above the grey line, the position is up overall; below, it’s down. This says nothing about any single purchase — some entries were at much lower prices than others — only about the running total. Each point is valued at the BTC/CHF price on that transaction’s date, so the line ends at the latest transaction rather than today’s price used in the key metrics above.
Full transaction log
Figures are built from the wallet’s on-chain transaction history, matched to daily BTC/CHF prices from Kraken’s real XBT/CHF market — a real traded pair, so no separate currency conversion is needed. The current market price used for “Portfolio value (CHF)” comes from the same market. This page is refreshed whenever new transactions are added and the site is rebuilt.