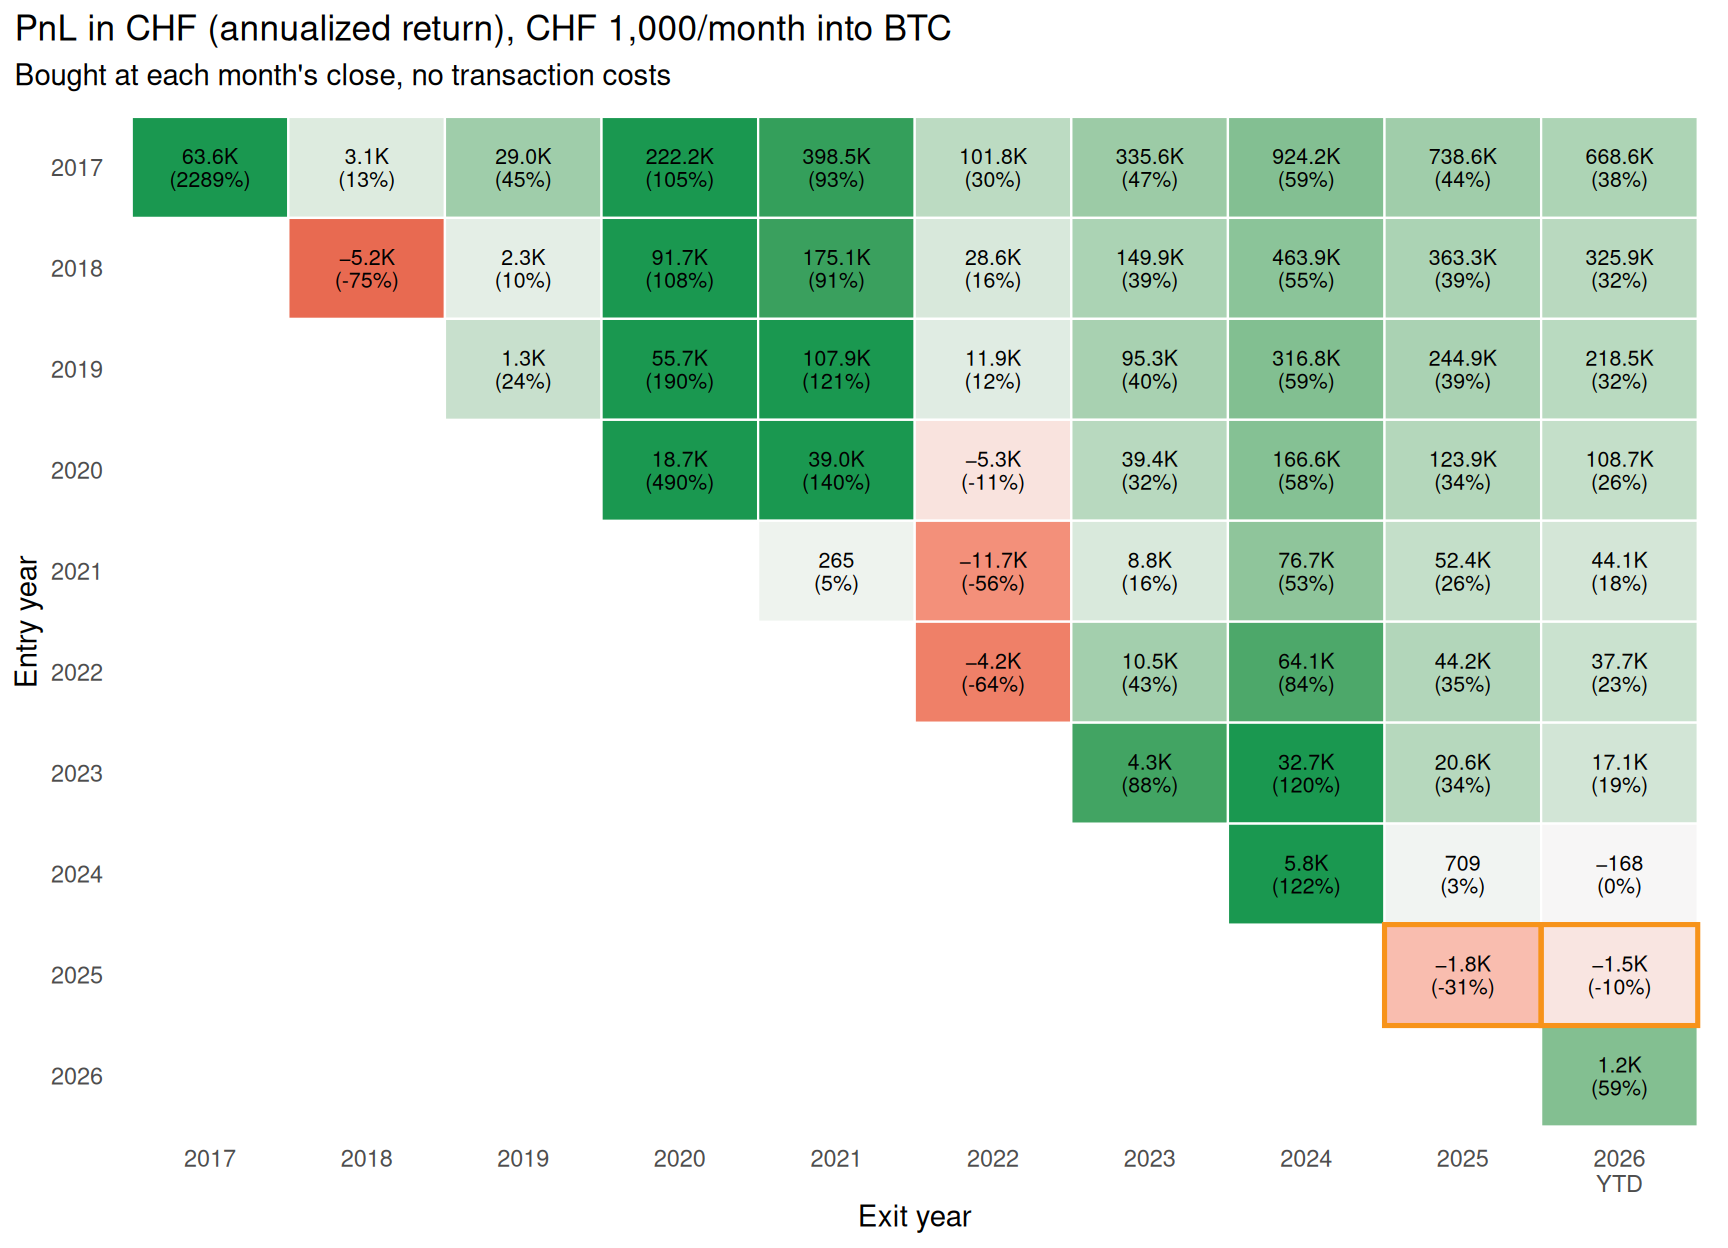
The Bitcoin return triangle: CHF 1,000 a month into BTC
Bitcoin
Inspired by the return triangles of the Deutsches Aktieninstitut, here’s the same idea for Bitcoin: a theoretical version of my own savings plan, started in each of the past 10 years. Each cell is a plan that starts in January of the row’s year and is valued at the end of the column’s year.
The triangle is deliberately theoretical:
- CHF 1,000 a month, no transaction costs. The full amount buys BTC.
- Bought at each month’s closing price, on the last day of the month.
- Valued at the closing price at the end of the exit year. Like the rest of the blog, this post updates with each new purchase, so prices run to September 30, 2026, the month-end of the latest transaction, and 2026 is a year-to-date figure. The Portfolio page has today’s values.
- Launched in 2025. The row of plans started in the year the actual plan was launched is outlined in orange.
Each cell shows the PnL in CHF, value minus everything paid in, with the annualized money-weighted return (IRR) in brackets, the same reading as the Deutsches Aktieninstitut triangles. The cell color follows the return in brackets. One-year plans annualize a few months of average holding time, which inflates the diagonal, so the colors cap at ±100% a year. PnL grows with the amount paid in: a plan running from 2017 has paid in up to CHF 117,000, one starting in 2026 only CHF 9,000 so far.
IRR vs. PnL-based return. The IRR is the constant yearly rate at which every CHF 1,000 would have to grow, from the day it was paid in, to reach the plan’s value. It accounts for timing: later contributions had less time to grow. The PnL-based return, PnL divided by everything paid in, is a total return over the whole plan, not per year. Long plans therefore show a much larger total return than IRR, while short ones can show a larger IRR, because a few months are scaled up to a year. As of September 30, 2026, the 2017 plan is at 637.2% in total, 39.2% a year as IRR; the 2025 plan is at 1.5% in total, 1.8% a year as IRR.
How the actual plan differs
The theoretical version of the actual plan, from January 2025 to September 30, 2026, is at CHF 313 (1.5%), shown in the outlined 2025/2026 cell. The September 30, 2026 row of the full transaction log shows −CHF 68 (−0.3%) for the real purchases. The percentage here is the total return, the same measure as the log’s PnL (%), not the annualized return shown in the triangle. The actual plan differs from the theory in four ways:
| Step | Difference | PnL (%) |
|---|---|---|
| Theoretical plan | CHF 313 (1.5%) | |
| Amount paid other than CHF 1,000 | +CHF 34 | CHF 347 (1.7%) |
| Fees and spread | −CHF 389 | −CHF 43 (−0.2%) |
| Settlement date and Kraken price per purchase | −CHF 39 | −CHF 82 (−0.4%) |
| Valued at Kraken’s close | +CHF 13 | −CHF 68 (−0.3%) |
- Amount paid other than CHF 1,000. January 2025: CHF 866, settled on February 3, 2025. Where the amount paid isn’t known, it assumes 2% costs on the BTC received.
- Fees and spread. Every purchase pays fees and a spread, estimated at 1.8% of the CHF paid, or CHF 375 in total. The estimate is the CHF paid minus the value of the BTC received at that day’s closing price. The theory has no costs. In the table, the fees count at what the BTC they would have bought is worth on September 30, 2026, −CHF 389.
- Settlement date and Kraken price. The actual purchases settle on or around the last business day of the month, and the log prices them at Kraken’s BTC/CHF close on that day. The theory uses the calendar month-end and Bitstamp’s BTC/USD close converted at the ECB’s USD/CHF rate.
- Valued at Kraken’s close. The log values the BTC at Kraken’s September 30, 2026 close of CHF 69,794, the theory at the September 30, 2026 close of CHF 69,750.
Methodology and caveats
- The triangle’s BTC/CHF price is Bitstamp’s daily BTC/USD close (UTC) multiplied by the European Central Bank’s USD/CHF reference rate. Kraken’s BTC/CHF prices, used for the transaction log, only go back about two years.
- The log’s fees and spread are estimated from the CHF paid, the BTC received and Kraken’s daily close, not taken from the provider’s actual execution price and fee.
- Taxes are ignored. Holdings are valued at the market price, with no sale and no selling fees.
- Ten years is a short history for an asset this volatile, and the earliest entry years are dominated by a few large bull markets. Past returns are not a reliable indicator of future returns.